
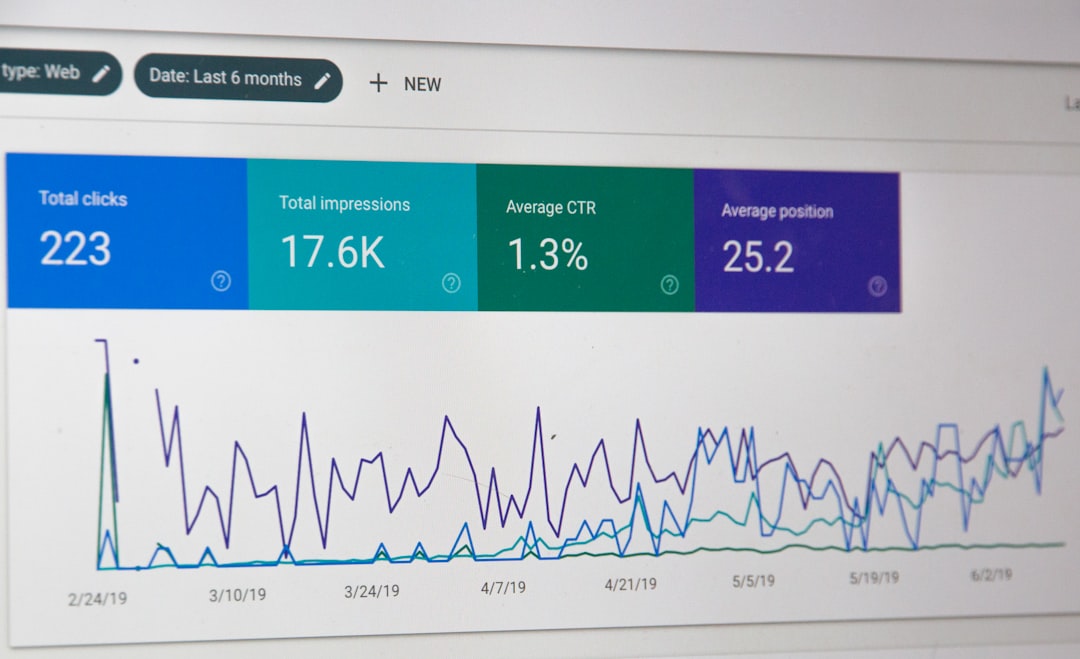
Digital marketing analytics is how you stop guessing and start running growth like a real operating system. If you are putting money into paid social or paid search, analytics is the difference between “we think it’s working” and “we know what’s driving revenue, what’s leaking budget, and what to test next.” At crackerJCK, measurement sits under every decision we make, because creative testing and budget allocation only work when you trust the numbers in front of you.
You do not need to be a data scientist. You do need a clean foundation, a short list of metrics that actually change what you do, and a rhythm for reviewing performance without living in dashboards. Let’s walk through a founder-friendly setup, the metrics that matter, and the common attribution traps that make smart teams act on bad information.
Digital marketing analytics means collecting and interpreting data from ads, site behavior, and downstream outcomes so you can make better decisions. Not prettier reports. Decisions. The point is to connect marketing activity to business results, then use that connection to plan, test, and forecast with less risk. That is the heart of how digital marketing analytics connects activity to business impact gets described, and it is a helpful lens for founders who are tired of “we got a lot of clicks.”
It also helps to separate this from web analytics. Web analytics tells you what happened on your site. Marketing analytics tries to explain why it happened and which channels played a role, especially when someone saw an ad on Meta, came back through Google later, and bought three days after that. If you internalize the distinction early, you will build reporting that answers growth questions instead of just tallying sessions.
When you are scaling, “close enough” data stops being close enough. CPMs move. Creatives burn out. Search intent shifts. Platforms will happily spend your budget no matter what your margins look like. Analytics gives you earlier warning signals, so you can fix the real issue instead of tossing budget at a symptom.
It also keeps you honest in finance conversations. If your reporting cannot tie spend to CAC, payback, pipeline, or contribution margin, you eventually lose the internal argument for more budget. You do not need perfect attribution to avoid that. You just need consistency and enough visibility to spot trends before they become expensive.
Most teams do not fail because they track too little. They fail because they track everything and still cannot answer the questions that drive decisions. Your setup should make these three answers easy to find:
If you cannot answer these, you end up over-crediting the last touchpoint. Branded search and retargeting usually look like heroes in last-click reports, even when they are just collecting the final handshake. That is how budgets drift toward demand capture and away from the work that creates demand in the first place.
You can build a solid measurement foundation without turning your company into a tracking project. Your goal is not perfect attribution. Your goal is a system that is stable, easy to QA, and good enough to run experiments against.
Once that exists, you can move faster with creative testing without playing whack-a-mole with broken reporting. If you want a companion read that pairs well with this, our breakdown of ad creative mistakes that quietly kill your ROAS is the kind of “we see this every week” list that saves real money.
Some metrics are useful. Some are loud. Founders get burned when the loud ones become the goal. Impressions, likes, and raw traffic can help you diagnose, but they are not the scoreboard. The scoreboard is whether you can acquire customers profitably and repeatably.
If you want the simplest rule: prioritize outcomes first, then use the other metrics to explain what is happening. That framing lines up with how marketing analytics should focus on outcomes gets explained, and it is exactly how we keep teams aligned when performance gets messy.
Metric: CTR
What it tells you: Is the hook and message earning attention?
How you should use it: Creative diagnostic, not a business KPI
Metric: Conversion rate
What it tells you: Are clicks turning into customers or qualified leads?
How you should use it: Landing page, offer, funnel health
Metric: CAC (or CPA)
What it tells you: What it costs to acquire a customer or qualified lead
How you should use it: Core scaling constraint
Metric: ROAS
What it tells you: Revenue efficiency of ad spend
How you should use it: Use alongside margin, LTV, and attribution context
Metric: LTV (or CLV)
What it tells you: How valuable a customer is over time
How you should use it: Sets your allowable CAC and payback targets
Measurement gets more complicated the moment you run multiple channels, because each platform has a built-in incentive to take credit. Meta can show you view-through conversions. Google can scoop up last-click intent. Both can be “true” inside their own reporting rules, and neither is the full story.
In paid social, optimization often lives at the creative level. You are testing concepts, hooks, angles, and formats. Meta’s Andromeda-era reality is that concept-driven creative testing is where most of the upside is, but it only works when your conversion events are clean and consistent. In paid search, the game is intent, query matching, and structure. You need separation between brand and non-brand so you do not confuse demand capture with demand creation.
And yes, the landscape changes under your feet. Google’s AI Overviews are shifting how users click around informational queries, which can make CTR feel like it is “breaking” even when the account is fine. If you are seeing that pattern, our analysis of why paid search CTR is falling with AI Overviews will help you reset expectations and adjust what you measure.
You do not need a perfect attribution model. You need one you can explain, defend, and use consistently. Most founders start by comparing three views: what platforms report, what your analytics platform reports, and what your CRM says happened later. The gaps between those views are where the truth usually lives.
If you are in the $2M to $10M range, clean tracking plus disciplined experimentation usually beats fancy tooling that nobody trusts. As spend grows, the tolerance for attribution error shrinks. At that point, you earn back the effort of more rigorous lift testing and tighter pipeline to source mapping.
A dashboard without a definition of “good” is just a stress machine. Before you decide what to track, decide what you are trying to achieve, then pick the metrics that prove it. Using S.M.A.R.T. goals is a simple way to force clarity, and the approach in this guide to digital marketing analytics and S.M.A.R.T. goal setting matches how we build targets with leadership teams.
From there, choose what you check weekly versus what you review monthly. Weekly is for leading indicators and fast feedback. Monthly is for budget decisions. Quarterly is for re-forecasting and larger strategy calls.
Here’s the cadence we see work when you have a business to run:
We also like to keep reporting in three layers so the team does not get lost:
This is where our non-negotiable comes in: everything runs in client-owned accounts. Your ad accounts and your data stay yours. Always. If you want to see how we operate day to day, start at the crackerJCK performance marketing agency home page.
The same issues show up across DTC, B2B, and apps. The good news is they are fixable without buying a new tool every month.
If you want us to pressure-test your setup, we will be direct about what is solid and what is risky. Email hello@crackerjck.co for a no-charge strategy conversation, or visit the crackerJCK case studies page if you want proof before you talk.
What is the difference between digital analytics and digital marketing analytics?
Digital analytics is the broad umbrella for measuring digital behavior, which can include product analytics. Digital marketing analytics is focused specifically on marketing performance across channels, campaigns, and revenue outcomes.
What should you review weekly as a founder?
At minimum: spend, conversions or qualified leads, CAC or CPA, and a revenue proxy that you trust. Keep CTR and conversion rate in the mix as diagnostics, not as the main score.
Is ROAS enough to decide whether to scale?
No. ROAS can be distorted by attribution windows, view-through credit, and customer mix. Pair it with margin, blended CAC, payback period, and LTV trends before you scale budget.
Do you need multi-touch attribution software?
Not always. Many teams get most of the value from clean UTMs, consistent conversion events, and CRM source tracking. Add more advanced attribution when your spend and channel mix justify it.
How do you know if tracking is broken?
Look for sudden conversion drops without site changes, big gaps between platform conversions and analytics conversions, inconsistent event counts, or unexplained shifts after cookie or iOS-related changes. A structured audit usually finds the issue fast.
Digital marketing analytics is not about collecting dashboards like trophies. It is about building a measurement system you trust, so you can test creative faster, allocate budget with confidence, and forecast growth in a way that holds up in a finance conversation. Start with clear goals, lock down tracking fundamentals, and report on outcomes like CAC, ROAS, and LTV. If you want a straight answer on what to fix before you scale, email us at hello@crackerjck.co.